Geovisualization Portfolio
Comprehensive Project
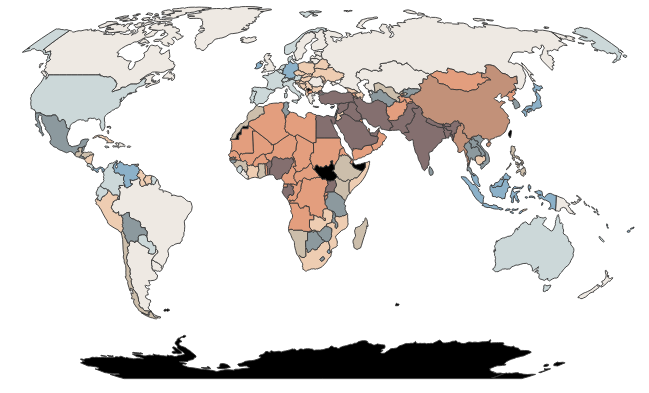
This is a comprehensive visualization and analysis case study. It maps the worldwide PM 2.5 exposure and annual GDP growth in 1990, 1995, 2000, 2005, 2011, and 2017 using dynamically-linked bivariate and small multiple choropleth maps.
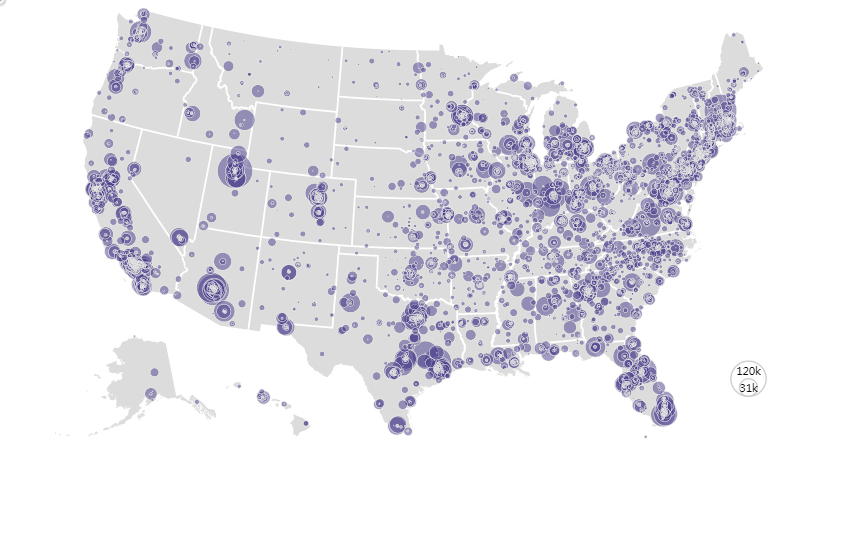
Proportional Symbol Mapping
This project maps the total enrollment for universities and colleges in the USA for the 2018-2019 school year using proportional symbol mapping.
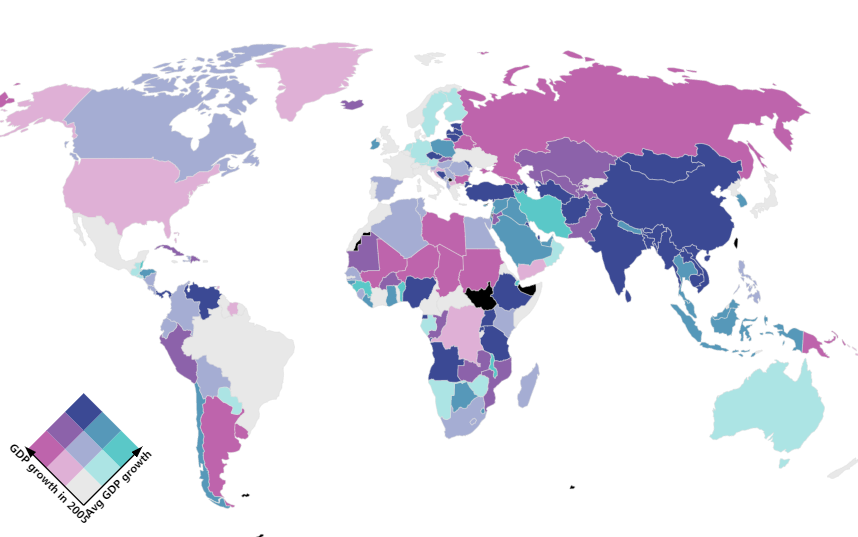
Bivariate Choropleth Mapping
This project maps annual GDP growth in 2005 and the average GDP growth of 1990, 1995, 2000, 2005, 2011, and 2017 using bivariate choropleth mapping.
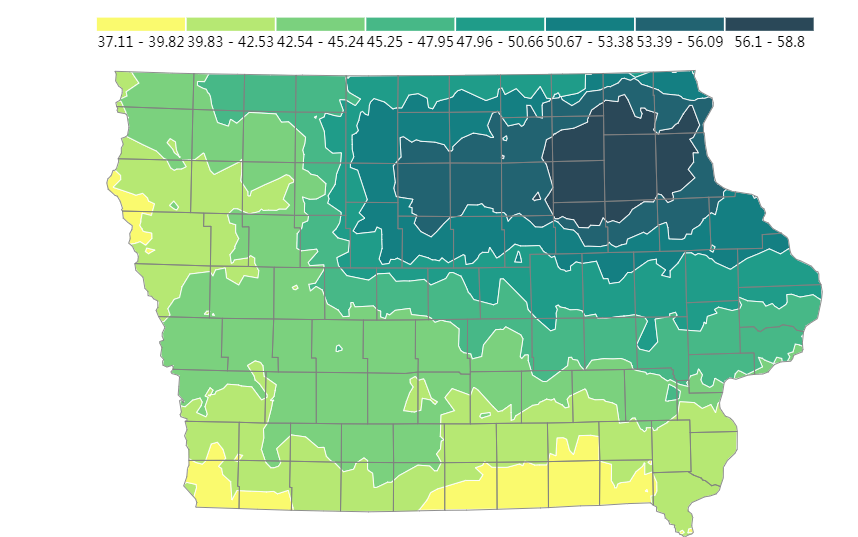
Isarithmic Mapping
This project maps yearly total precipitation in Iowa using isarithmic mapping.
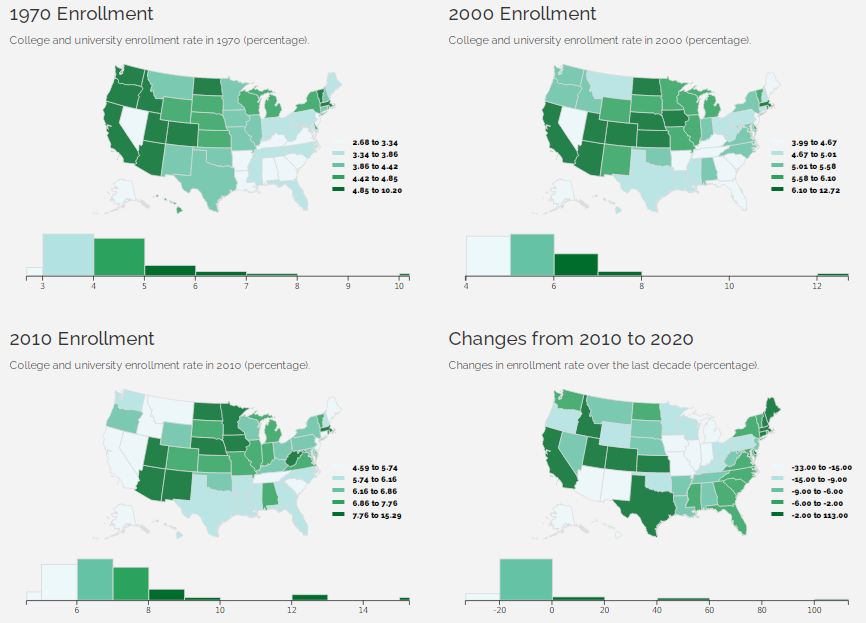
Dynamically-Linked Small Multiple Choropleth Maps
This project creates dynamically-linked small multiple choropleth maps for college and university enrollment changes by state from 1970 to 2020.
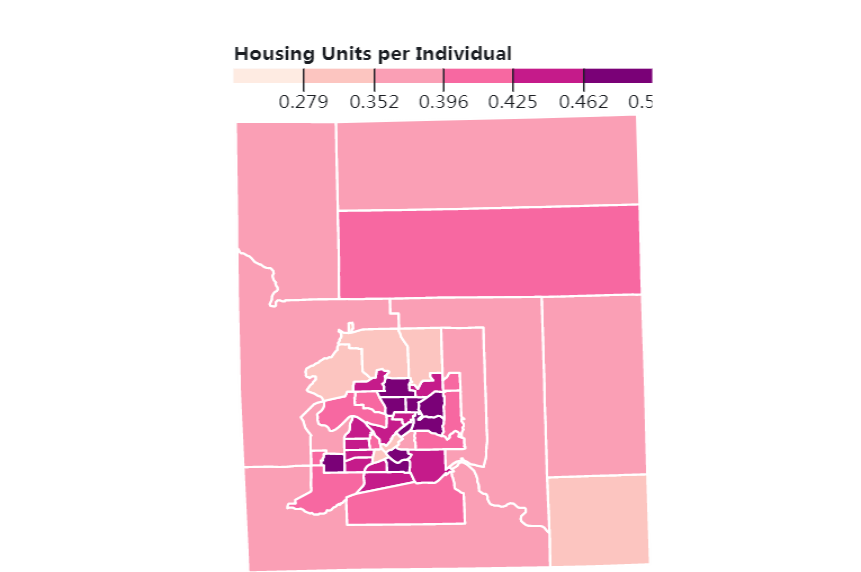
Choropleth Mapping
This project visualized the housing units per individual in Linn county, Iowa, using choropleth mapping.